Thursday, January 26, 2012

Building Nexus vPC Keepalive Links

There's some contradictory and unhelpful information out there on vPC peer keepalive configuration. This post is a bit of a how-to, loaded with my opinions about what makes sense.

What Is It?
While often referred to as a link, vPC peer keepalive is really an application data flow between two switches. It's the mechanism by which the switches keep track of each other and coordinate their actions in a failure scenario.

Configuration can be as simple as a one-liner in vpc domain context:
vpc domain <domain-id>
  peer-keepalive destination 
<peer-ip-addr>
Cisco's documentation recommends that you use a separate VRF for peer keepalive flows, but this isn't strictly necessary. What's important is that the keepalive traffic does not traverse the vPC peer-link nor use any vPC VLANs.

The traffic can be a simple L2 interconnect directly between the switches, or it can traverse a large routed infrastructure. The only requirement is that the switches have IP connectivity to one another via non-vPC infrastructure. There may also be a latency requirement - vPC keepalive traffic maintains a pretty tightly wound schedule. Because the switches in a vPC pair are generally quite near to one another I've never encountered any concerns in this regard.

What If It Fails?
This isn't a huge deal. A vPC switch pair will continue to operate correctly if the vPC keepalive traffic is interrupted. You'll want to get it fixed because an interruption to the vPC peer-link without vPC keepalive data would be a split-brain disaster.

Bringing a vPC domain up without without the keepalive flow is complicated. This is the main reason I worry about redundancy in the keepalive traffic path. Early software releases wouldn't come up at all. In later releases, configuration levers were added (and renamed!?) to control the behavior. See Matt's comments here.

The best bet is to minimize the probability of an interruption by planning carefully, thinking about the impact of a power outage, and testing the solution. Running the vPC keepalive over gear that takes 10 minutes to boot up might not be the best idea. Try booting up the environment with the keepalive path down. Then try booting up just half of the environment.

vPC Keepalive on L2 Nexus 5xxx
The L2 Nexus 5000 and 5500 series boxes don't give you much flexibility. Basically, there are two options:
  1. Use the single mgmt0 interface in the 'management' VRF. If you use a crossover cable between chassis, then you'll never have true out-of-band IP access to the device, because all other IP interfaces exist only in the default VRF, and you've just burned up the only 'management' interface. Conversely, if you run the mgmt0 interface to a management switch, you need to weigh failure scenarios and boot-up times of your management network. Both of these options SPoF the keepalive traffic because you've only got a single mgmt0 interface to work with.
  2. Use an SVI and VLAN. If I've got 10Gb/s interfaces to burn, this is my preferred configuration: Run two twinax cables between the switches (parallel to the vPC peer-link), EtherChannel them, and allow only non-vPC VLANs onto this link. Then configure an SVI for keepalive traffic in one of those VLANs.
vPC Keepalive on L3 Nexus 55xx
A Nexus 5500 with the L3 card allows more flexibility. VRFs can be created, and interfaces assigned to them, allowing you to put keepalive traffic on a redundant point to point link while keeping it in a dedicated VRF like Cisco recommends.

vPC Keepalive on Nexus 7000
The N7K allows the greatest flexibility: use management or transit interfaces, create VRFs, etc... The key thing to know about the N7K is that if you choose to use the mgmt0 interfaces, you must connect them through an L2 switch. This is because there's an mgmt0 interface on each supervisor, but only one of them is active at any moment. The only way to ensure that both mgmt0 interfaces on switch "A" can talk to both mgmt0 interfaces on switch "B" is to connect them all to an L2 topology.

The two mgmt0 interfaces don't back each other up. It's not a "teaming" scheme. Rather, the active interface is the one on the active supervisor.

IP Addressing
Lots of options here, and it probably doesn't matter what you do. I like to configure my vPC keepalive interfaces at 169.254.<domain-id>.1 and 169.254.<domain-id>.2 with a 16-bit netmask.

My rationale here is:
  • The vPC keepalive traffic is between two systems only, and I configure them to share a subnet. Nothing else in the network needs to know how to reach these interfaces, so why use a slice of routable address space?
  • 169.254.0.0/16 is defined by RFC 3330 as the "link local" block, and that's how I'm using it. By definition, this block is not routable, and may be re-used on many broadcast domains. You've probably seen these numbers when there was a problem reaching a DHCP server. The switches won't be using RFC 3927-style autoconfiguration, but that's fine.
  • vPC domain-IDs are required to be unique, so by embedding the domain ID in the keepalive interface address, I ensure that any mistakes (cabling, etc...) won't cause unrelated switches to mistakenly identify each other as vPC peers, have overlapping IP addresses, etc...
The result looks something like this:
vpc domain 25
  peer-keepalive destination 169.254.25.2 source 169.254.25.1 vrf default
vlan 2
  name vPC_peer_keepalive_169.254.25.0/16
interface Vlan2
  description vPC Peer Keepalive to 5548-25-B
  no shutdown
  ip address 169.254.25.1/16
interface port-channel1
  description vPC Peer Link to 5548-25-B
  switchport mode trunk
  switchport trunk allowed vlan except 1-2
  vpc peer-link
  spanning-tree port type network
  spanning-tree guard loop
interface port-channel2
  description vPC keepalive link to 5548-25-B
  switchport mode trunk
  switchport trunk allowed vlan 2
  spanning-tree port type network
  spanning-tree guard loop
interface Ethernet1/2
  description 5548-25-B:1/2
  switchport mode trunk
  switchport trunk allowed vlan 2
  channel-group 2 mode active
interface Ethernet1/10
  description 5548-25-B:1/10
  switchport mode trunk
  switchport trunk allowed vlan 2
  channel-group 2 mode active
The configuration here is for switch "A" in the 25th pair of Nexus 5548s. Port-channel 1 on all switch pairs is the vPC peer link, and port-channel 2 (shown here) carries the peer keepalive traffic on VLAN 2.

Wednesday, January 25, 2012

Hot Hot Hot FEX Fix!

Cisco Nexus 2xxx units run hot in a typical server cabinet because their short depth causes them to ingest hot air produced by servers. Exhaustive (get it?) detail here.

Until now, the best fix has been the Panduit CDE2 inlet duct for Neuxs 2000 and Catalyst 4948E:

The CDE2 works great, but has some downsides:
  • Street price according to a google shopping search is around US $400.
  • It doubles the space required for installing a FEX.
  • Post-deployment installation of the CDE2 will be disruptive - it can't be retrofitted.
Today I learned that Cisco has released their own fix for the N2K's airflow woes. The NXA-AIRFLOW-SLV= "Nexus Airflow Extension Sleeve" is currently orderable, and it lists for only $150!


I've never seen one of these buggers, but I've heard that it's only 1RU, which is nice. I don't have any other detail about it.

I hope that it will be simple to retrofit onto currently installed Fabric Extenders.

UPDATE 2/1/2012 I have some additional information about the NXA-AIRFLOW-SLV.

It's orderable, but the lead times tool indicates that it's on New Product Hold. Cisco tells me that the sleeve will have full documentation and will make an appearance in the dynamic configuration tool (as an N2K option) within a couple of weeks.

In the mean time, there's this: Temperature-Solutions-note.pdf

That document includes the following pictures of the implementation:
Duct with airflow sketch

Installation drawing

FEX with duct installed

Installing this bugger onto an existing FEX (especially one with servers mounted immediately above and below) will be an interesting exercise in problem solving, but looks possible. Power supply cables will need to be threaded through the duct before it's put into place. I wonder if the 2m power cords will be able to reach from the FEX, around the cold-side rack rail, and then all the way to the PDU in the hot aisle?

Also covered in the document is an interesting inlet duct (more of a hat) for reverse airflow FEXen (those with intake on the port end):
Inlet hat for reverse airflow FEX

This guy makes sense if the FEX is mounted flush with the rack rails (as shown above) and has no equipment installed in the space directly above it. It'd probably be easier to mount the FEX so that the intake vent protrudes beyond the mounting rail like this:
FEX standing proud of the rack mounting rail
...But this sort of mounting is usually only possible on the hot side of a cabinet. The cold side is usually pretty close to the cabinet door, and wouldn't tolerate 2" of FEX plus a couple of inches of cable protrusion. This accessory (the hat) doesn't seem to be orderable yet.

Monday, January 23, 2012

Nexus vPC Orphan Ports

"Orphan Port" is an important concept when working with a Cisco Nexus vPC configuration. Misunderstanding this aspect of vPC operation can lead to unnecessary downtime because of some of the funny behavior associated with orphan ports.

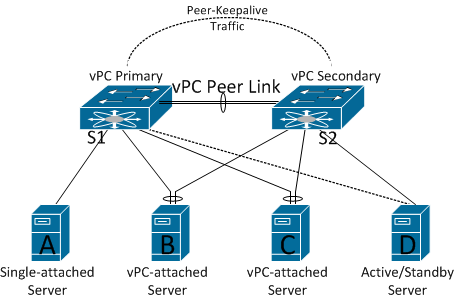
Before we can define an orphan port, it's important to cover a few vPC concepts. We'll use the following topology.


Here we have a couple of Nexus 5xxx switches with four servers attached. The switches are interconnected by a vPC peer link so that they can offer vPC (multi-chassis link aggregation) connections to servers. The switches also exchange vPC peer-keepalive traffic over an out-of-band connection.

Lets consider the traffic path between some of these servers:
A->B
A->C
This traffic takes a single hop from "A" to its destination via S1.
B->A
C->A
The path of this traffic depends on the which link the server's hashing algorithm chooses. Traffic might go only through S1, or it might take the suboptimal path through S2 and S1 (over the peer link).
B->C
C->B
The path of this traffic is unpredicatable, but always optimal. These servers might talk to each other through S1 or through S2, but their traffic will never hit the peer link under normal circumstances.
A->D
D->A
This traffic always crosses the peer link because A and D are active on different switches.

Definitions:
vPC Primary / Secondary - In a vPC topology (technically a vPC domain), one switch is elected primary, and the other secondary according to configurable priorities and MAC address-based entropy. The priority and role is important in cases where the topology is brought up and down, because it controls how each switch will behave in these exceptional circumstances.

vPC peer link - This link is a special interconnection between two Nexus switches which allows them to collaborate in the offering of multi-chassis EtherChannel connections to downstream devices. The switches use the peer link to "get their stories straight" and unify their presentation of the LACP and STP topologies.

The switches also use the peer link to synchronize the tables they use for filtering/forwarding unicast and muliticast frames.

The peer link is the centerpiece of the most important thing to know about traffic forwarding in a vPC environment: A packet which ingresses via the peer link is not allowed to egress a vPC interface under normal circumstances.

This means that a broadcast frame from server A will be flooded to B, C and S2 by S1. When the frame gets to S2, it will only be forwarded to D. S2 will not flood the frame to B and C.

vPC peer keepalive - This is an IP traffic flow configured between the two switches. It must not ride over the peer link. It may be a direct connection between the two switches, or it can traverse a some other network infrastructure. The peer keepalive traffic is used to resolve the dual-active scenario that might arise from loss of the peer link.

vPC VLAN - Any VLAN which is allowed onto the vPC peer link is a vPC VLAN.

Orphan Port - Any port not configured as a vPC, but which carries a vPC VLAN. The link to "A" and both links to "D" are orphan ports.

So why do orphan ports matter?
Latency: Traffic destined for orphan ports has a 50/50 chance of winding up on the wrong switch, so it will have to traverse the peer link to get to its destination. Sure, it's only a single extra L2 hop, but it's ugly.

Bandwidth: The vPC peer link ordinarily does not need to handle any unicast user traffic. It's not part of the switching fabric, and it's commonly configured as a 20Gb/s link even if the environment has much higher uplinks and downlinks. Frames crossing the peer link will incur extra header (this is how S2 knows not to flood the broadcast to B and C in the previous example) and possibly overwhelm the link. I've only ever seen this happen in a test environment, but it was ugly.

Shutdown: This is the big one. If the peer link is lost, bad things happen. The vPC secondary switch (probably the switch that rebooted last, not necessarily the one you intend) will disable all of his vPC interfaces, including the link up to the distribution or core layers. In this case, server D will be left high-and-dry, unable to talk to anybody. Will server D flip over to his alternate NIC? Most teaming schemes decide to fail over based on loss of link. D's primary link will not go down.

If the switches are layer-3 capable, the SVIs for vPC VLANs will go down too, leaving orphan ports unable to route their way out of the VLAN as well.

No Excuse
There are configuration levers that allow us to work around these failure scenarios, but I find it easier to just avoid the problem in the first place by deploying everything dual-attached with LACP. Just don't create orphan ports.

We're talking about the latest and greatest in Cisco data center switching. It's expensive stuff, even on a per-port basis. Almost everything in the data center can run LACP these days (Solaris 8 and VMware being notable exceptions), so why not build LACP links?

Thursday, January 19, 2012

Ethernet Taps - Don't Get Me Started

Photo by sparktography - Found on flickr
I got to pull some Ethernet taps out of the closet to diagnose a problem last week, and was inspired to bang some thoughts about taps into my keyboard. So here they are: More than you probably want to know about Ethernet taps.

Ethernet taps are in-line devices used for capturing data between two systems. They're not the weapon-of-choice when troubleshooting application layer problems because mirror functions on switches (SPAN) and capture mechanisms on servers (tcpdump / wireshark) are much more convenient here.

Where taps really shine is for the sorts of problems which might cause you to mistrust one or both of the systems on the ends of a link.

Say we've got a performance-related packet delivery problem. It's possible that the switch mirror function will claim that a frame was sent when in reality the frame was dropped due to a buffering problem downstream of the mirror function.

On the other hand,  there are times when packet captures performed at the server claim packets went undelivered or were delivered late when in reality the packets were delivered just fine.

You also might want to save your (limited) mirror sessions for tactical work, rather than burning up this resource for a long-term traffic monitoring solution.

So, what do you do when mirror (SPAN) and capture (tcpdump) disagree about what packets were delivered, or you want to deploy a long-term strategic monitor? You put a tap in the link.

Optical Taps
The simplest form of Ethernet tap is a fiber optic splitter. Light enters the splitter via the blue fiber on the left, and is split into the blue and red fibers on the right:

The following photo illustrates the function. Light from my flashlight is appearing in both the red and blue fibers.

One of those fibers will be connected to the analysis station, and the other one to the destination system (the other end of the link).

Optical taps are generally packaged in pairs: one for "Northbound" traffic and one for "Southbound" traffic on the link. Here's a typical assembled tap:


Optical taps don't require any power, and they're generally safe for long-term deployment on critical infrastructure links. They can be used for 10Mb/s, 100Mb/s, 1Gb/s or 10Gb/s links (it's just glass afterall), so long as the fiber is the correct type in terms of modality and core diameter.

Taps like this generally express the amount of light delivered through the link vs. delivered to the analysis station in terms of db loss. You'll want to consider your cable lengths and light power budget when installing one of these taps. When tapping in-room links, I've never had any problem using splitters that divide the light power evenly.

Passive Copper Taps
Passive copper taps for 10Mb/s and 100Mb/s links work pretty much the same way as optical taps, but with electrons, not photons.

You can build a totally passive tap for just a few dollars worth of parts from a hardware store. The result is a totally passive tap that requires no power and looks like this:

These taps are effective, but I'd think twice about using them in a production environment. Playing games with the signal in this way can lead to unpredictable results, maybe even broken equipment.

Update 1/26/2012 - duaneo shared this picture of his passive tap panel:
duaneo's tap panel
Apparently it's been doing tap duty at a financial services provider for years without issue. He's got it fed into a linux system "crammed full of NICs bonded together." Nifty, thanks for sharing!

Commercial passive taps generally work the same way, but instead of connecting the tap ports directly to the forked traces on the circuit board, they run the tapped traces into some high-impedance ethernet repeater equipment. The signal is then repeated at full strength by powered transmit magnetics. This minimizes degradation of the link under test, and ensures that a wiring mistake on the tap ports can't knock out the link.

These sorts of taps only require power to produce the signal for the analyzer. Power loss at the tap will not impact data flow on the link under test. Accordingly, they're safe to use for long-term deployment on critical infrastructure links.

Gigabit Copper Taps
It is not (AFAIK) possible to passively tap gigabit copper links. The problem here is that with 1000BASE-T links, all copper pairs (there are four of them) are simultaneously transmitting and receiving. The stations on each end of the cable are able to distinguish incoming voltages from outgoing because they know what they've sent. They subtract the voltage they've put onto the wire pairs from the voltage they observe there. The result of this subtraction is the voltage contributed by the other end, which is the incoming signal.

An intermediary on the wire (the tap) cannot make that distinction, so the voltages observed by a 3rd party are just undecipherable noise.

Tap manufacturers don't like to admit this, but 1000BASE-T taps are never passive devices. They're more like a small switch with mirror functions enabled. The Ethernet link on both ends is terminated by the tap hardware, and frames traversing the link under test are repeated by the tap.

1000Base-T tap manufacturers mitigate the risk of installing their wares by providing redundant power supplies, internal batteries, and banks of relays which will re-wire the internals (reconnecting the link under test) if power to the tap fails.

Manufacturers use terms like "link lock", "zero delay", "zero impact", "fail safe", "totally passive" and "permanent network link" to describe their taps, but I don't believe that it's possible to implement a truly safe 1000BASE-T tap. If I'm wrong about this, please enlighten me in the comments!

Consider some confusing language (new version of the manual here) used by the manufacturers:
The major features of the CA full-duplex Copper TAPs are:
  • Passive access at 10/100 or 1000 Mbps without packet tampering or introducing a single point of failure
Then, later in the same document:
With a 10/100/1000 Mb Copper TAP, the TAP must be an active participant in the negotiated connections between the network devices attached to it. This is true if the TAP is operating at 10, 100, or 1000 Mb. Power failure to the TAP results in the following: ...
  • If you are not using a redundant power supply or UPS or power to both power supplies is lost, then:
...
  • The TAP continues to pass data between the network devices connected to it (firewall/router/switch to server/switch). In this sense the TAP is passive.
  • The network devices connected to the TAP on the Link ports must renegotiate a connection with each other because the TAP has dropped out. This may take a few seconds.
Using the term "passive" to describe a system where the tap actively terminates the Ethernet link with both end stations, and where the frames are passed through moving parts (relays) makes my head spin.

Here's a shot of the relays in that "passive" tap:

Interestingly, this tap uses a bel MagJack, which packages the RJ45 jack and the Ethernet magnetics into a single unit. I gotta confess that I'm a little puzzled about how the relays do their job here, because the MagJack doesn't provide direct access to the Ethernet leads, only to the magnetics. I guess running the integrated magnetics back-to-back (through the relays), without a contiguous Cat5 cable is acceptable?

If anybody from Network Instruments (Hi Pete!) wants to chime in, I'd love to hear how/why this works. Sorry about bashing your marketing there, but the other guys are about to get their turn...

Update (1/25/2012): I pinged Rich Seifert with the question about back-to-back MagJacks. Rich said:
Yes, it is possible to "pass through" an Ethernet connection (10, 100, or 1000BASE-T) using a pair of back-to-back transformers. There will be some loss, so it will reduce the maximum allowable link length from the 100m specification, but in most environments this is not an issue.

Another interesting thing about this tap is how the board is setup to build many different products. On the left are a pair of SFP connectors (you can see one of them in the image) that are unused on my model. Around back are solder pads for a SO-DIMM memory holder, presumably this is the packet buffer for the aggregation tap models. Nifty.

Here's another example of misleading marketing:
With the Gig Zero Delay Tap, power glitches and failures no longer mean dropped packets and lengthy renegotiation sequences. Your network operates more smoothly and your critical business applications remain responsive with the Gig Zero Delay Tap in your monitoring infrastructure.
Sounds great, right? They fail to mention how that really works:
Warning! ... This product contains a NiMH battery. Consult your shipping carrier regarding regulations on safe shipping of NiMH batteries.
So, no dropped packets on power failure (until the batteries run out). I don't know why these sort of claims tend to be so over-inflated, but the problem is nearly universal:


  • Operates transparently.
  • ...
  • Can be left in place permanently.
  • ...
  • Provides continuous network data flow if the power fails.
  • Just like the first one, this tap will go "click!" as the relays re-route traffic during a power failure. Sure, it's milliseconds-fast, but does that matter? An MS Windows based server will destroy all of its TCP sessions in the face of momentary link loss. Spanning tree might have to reconverge. Routing information learned over the link will be lost. That "click!" can be devastating.

    I believe that this tap is actually exactly the same thing as the first tap I mentioned, but with a different paint and stickers. I prefer to buy my gear from the real manufacturers.

    I want to take this opportunity to give a shout-out to the folks at Network Critical. I just perused some of their product materials and I didn't find anything misleading in this regard. Way to go, guys!

    I've used taps from all of the companies I linked above. They were all good products. I just wish the marketing departments were more forthcoming about what's really going on inside the boxes. Having to figure out that "zero delay" means "onboard battery with limited lifetime" is ridiculous.

    Active taps scare me. They're a point of failure that doesn't have to be there.


    Aggregator Taps
    All of the taps I've described so far are "full duplex" taps. This means that you need two sniffer/analyzer ports in order to see bidirectional data. One tap port will deliver "Northbound" frames to the sniffer, and the other will deliver "Southbound" frames.

    Aggregator taps on the other hand, combine northbound and southbound data into a single analyzer interface. This is convenient, because aggregating the data can be a hassle, but aggregation inside the tap introduces some downsides:
    1. Aggregator taps are more expensive because they include processor, buffering and arbitration logic not required by full duplex taps.
    2. Aggregator taps will delay and possibly drop frames because the analyzer port is oversubscribed 2:1.
    It's interesting to note that some of the "zero delay" taps tout their large packet buffers on the analyzer ports. If data isn't being delayed, what's this huge packet buffer for? In this case, it's "zero delay" refers only to the link under test, and it doesn't really mean anything about delay... It's the marketing term for relays and batteries. The fact is, tap output data may be delayed up to 160ms (2MB buffer draining at 100Mb/s) with this device. Does it matter to you? Maybe. Does it sound anything like zero delay? I'd wager not.

    Aggregator taps make good sense when dealing with sub-rate services (100Mb/s service on a gigabit link), or when monitoring heavily uni-directional applications like financial pricing feeds or IPTV services. If it's likely that the combined bidirectional traffic will exceed the speed of the analyzer port, then I prefer to use full-duplex taps with a dedicated tap aggregation appliance

    Unlike full duplex taps, an aggregator tap is always a powered device that generates a fresh (repeated) copy of each frame for the analyzer. This does not mean that an aggregator tap can't be passive. It can be, just like the 10/100 copper tap I diagrammed above. So long as the path of the link under test only crosses passive components, the tap is passive, regardless of whether the copied frames are fed into an aggregation engine.

    Some aggregator taps are configurable: they can operate in either full-duplex mode or they can provide aggregated traffic to two different analyzers.

    Tap Chassis
    Lots of manufacturers are offering chassis of various sizes that can do tapping, aggregation and (sometimes) analysis all in one box. While each of these functions are useful, I shy away from these appliances.

    Critical network links don't tend to be all in one spot. Deploying one of these appliances requires that each interesting / critical network link needs to be patched back to the same point in the data center. A mechanical problem (fire, rack falling through the floor, etc...) could hurt every one of these critical links if you run them through the same physical spot in your facility.

    Rather than bringing each link over to the One True Chassis, I prefer to bring small inexpensive taps to each link. Tap the links in situ, and send your copy of the data back to the analysis gear, instead of the other way around.

    Build Fiber Gig Links
    Because you can't passively tap a gigabit copper link, I think it's irresponsible to build 1000BASE-T links in critical parts of the infrastructure where you're likely going to want to do analysis. This means you should always specify optical modules for security edge and and distribution tier devices. Sure, the "firewall sandwich" at the internet edge all lives in a couple of racks, and copper links would work fine. Doesn't matter. The SecOps guys will show up with some nonsense security appliance/sniffer/DLP/IDS/EUEM device that they want to put inline. If your links are copper, tapping them will add points of failure. There's no reason to take this risk.

    Layer 1 Switches
    These are neat products that basically boil down to electronic patch panels. They're great for tactical work.

    Imagine a remote office building with 50 switches in various wiring closets that all patch back to a central distribution tier. You can enable a mirror function on all 50 switches, and patch the mirror port back the the L1 switch.

    Also plugged into the L1 switch, you'll have an analyzer port.

    When there's a network problem in closet 23, you log into the L1 switch and configure it to patch port 23 to the analyzer station. The switch makes some clicking noises, and now your analyzer is plugged into closet 23's mirror port, without you having to visit the site and build that patch. Pretty nifty.

    Tap Aggregators
    There are several companies selling tap aggregators. These products allow you to distribute data from several data sources (taps, mirror ports) into several analyzer tools. Most of them allow you to filter traffic coming from sources or flowing to tools, snap payloads off of packets, etc...

    Use cases include:
    • Feed HTTP traffic from all sources to the web server customer experience monitor.
    • Feed voice bearer traffic (without payloads for compliance purposes) to an IP telephony quality scoring system.
    • Monitor SMTP traffic from all ports only to the confidential data loss analyzer system.
    In addition to those strategic uses, you might have a couple of tactical diagnostic tools plugged into the aggregator. When problems arise, you configure the aggregator to feed the interesting traffic to the analysis tool.

    Change Control
    I've successfully made the case that everything on the "copy" side of Ethernet taps should fall outside the scope of change control policies in a couple of organizations. This has allowed me to perform code upgrades on really smart taps, reconfigure L1 and aggregation switches etc... during business hours.

    It's critical that these tools be available for tactical use during business hours, but most large enterprises won't take the perceived risk of allowing this type of work unless you plan ahead. Start planting the seeds for mid-day tactical work during network planning stages. Get exceptions to change control coded into "run books", "ops manuals", "architectural documents" or whatever documentation makes your organization tick.

    Wednesday, January 18, 2012

    Oh No! What Will Greg Ferro Think?

    Mrs. Chris Marget commissioned these awesome Router and Switch cufflinks for me as a Christmas gift.


    I love 'em, but wonder if I'm allowed to wear them on the job? Greg Ferro didn't address French cuffs in his Fashion Tips for Network Engineering Men rant post. Maybe the CCIE-Fashion (I believe Greg is the first to sport this title?) will weigh in with a ruling.

    Greg, I promise to wear them only with black shoes and a wide black belt :-)

    They were made by Lauren Swingle of TheClayCollection. Lauren sculpts all manner of nerdy jewelry out of plastic polymer clay, as can be seen from the banner I swiped from her etsy store:


    You can get your own pair by emailing Lauren at: 


    Update 20 Jan 2012: Well this is a big relief!  :-)

    Saturday, January 7, 2012

    Dispatches From The Trading Floor - Analysis Technique

    In the comments on my MoldUDP analysis post, Will asked:
    So...uh, what are the chances you can show us in detail how you made those graphs?
    And Will wasn't the only one to approach me with that question.

    Well... I have a confession to make. I didn't have any MoldUDP data handy when I wrote that post. Not even a single packet.

    Instead, what I had was a screencast that I recorded in 2007 or 2008. A screencast with a huge ugly watermark right through the middle of it.

    So, in order to write the article, I pulled some stills from the screencast, edited out the watermark, and stuck 'em in the blog post.

    I've decided to share the original screencast. I don't explain too much about how the protocol works or what the plot represents in this clip. Most of that info is contained in the previous post. Read it first.

    Mostly, this screencast is intended to give a sense of how I'd actually do the analysis, and how quickly my tools allow me to tear through huge capture files and spot interesting problems.

    The tools convert sniffer data into the interactive plots I demonstrate here. It's pretty fast. The packet capture I'm working with in this clip is about 30 seconds of data with roughly 300,000 packets. Import of this captured data ran at about 2x realtime (15 seconds) on my 2005 vintage G4 Macintosh. Working with the data once it's been imported is super snappy, almost no delay at all.

    I'm sorry about the Demo Version watermark, the bleeps (company names - I wasn't cursing) and the general lack of polish and context. This video wasn't intended for wide distribution, nor for someone unfamiliar with the protocols in question - I made it for a colleague who was helping me work through a packet delivery issue.

    Readers of my blog have expressed enough of an interest in trading floor trivia that I hope you'll all be willing to look past the warts.


    I <3 protocols.

    Tuesday, January 3, 2012

    Dispatches From The Trading Floor - MoldUDP

    My pricing networks post has gotten a lot of feedback. Because of its popularity, I've decided to write up a case study detailing one of the interesting problems I was asked to solve.

    The Incident
    One morning around 10:00, a pricing support guy cornered me in the hallway: "Hey, did something happen at 9:34 this morning? We lost some data on the NASDAQ ITCH feed... Did you notice anything?"

    When I got back to my desk, I found that pricing support had left some feed handler logs in my inbox. The logs explained that three consecutive pricing updates had been lost, and attributed the problem to "network loss" or somesuch. An incident had been opened, and I needed to get to the bottom of it.

    Background
    At that time, the NASDAQ ITCH data feed was delivered as a stream of IP multicast packets containing UDP datagrams. Inside those UDP datagrams was a protocol known as MoldUDP.

    MoldUDP is a simple encapsulation protocol for small messages which are intended to be delivered in sequential order. It assigns a sequence number to each message, prefaces each message with a two byte message length field, and then packs the messages into a MoldUDP packet using an algorithm that balances latency (dispatch the message NOW!) with efficiency (gee, there's still room in this packet, any more messages coming?) There were usually between 1 and 5 messages per packet in this environment.

    The MoldUDP packet header includes:
    • The sequence number of the first message in this packet.
    • The count of messages in this packet.
    • A "session ID" which allows receiving systems to distinguish multiple MoldUDP flows from one another.
    The resulting packet looks something like this:
    Downstream MoldUDP packet format

    The key things to remember about MoldUDP for this story are:
    • Each message is assigned a unique number
    • Multiple messages can appear in a single packet
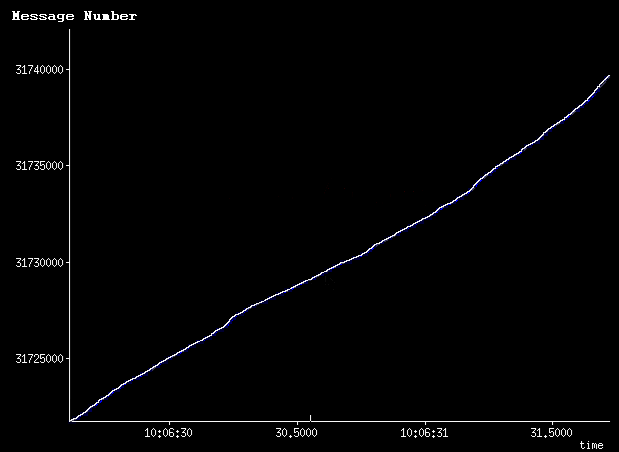
    Every morning, the MoldUDP sequence starts at zero. As the day goes by, the message numbers go up. I like to visualize the message stream like this:
    MoldUDP message stream derived from sniffer capture
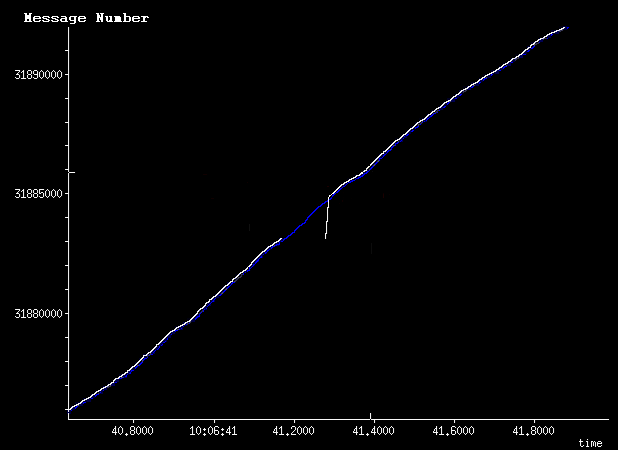
    The plot shows the MoldUDP sequence numbers recevied vs. time. The slope of the graph indicates the message rate. In this case, we got about 17,000 messages in about 2.5 seconds. 6800 messages per second overall, with a couple of little blips and dips in the rate (slope).

    I created these plots from sniffer data using the Perl Net::PcapUtils and NetPacket::UDP libraries, along with some MoldUDP-fu of my own. The data pictured here is not the data from the incident (I don't have it anymore), but it illustrates the same problem.


    Diversity
    As I explained in the previous post, pricing networks don't just have redundancy, they have diversity.

    Accordingly, the ITCH feed is delivered to consuming systems twice. The two copies of the data come from different NASDAQ systems, on different multicast groups, over different transit infrastructure, to different NICs on the receiving systems.

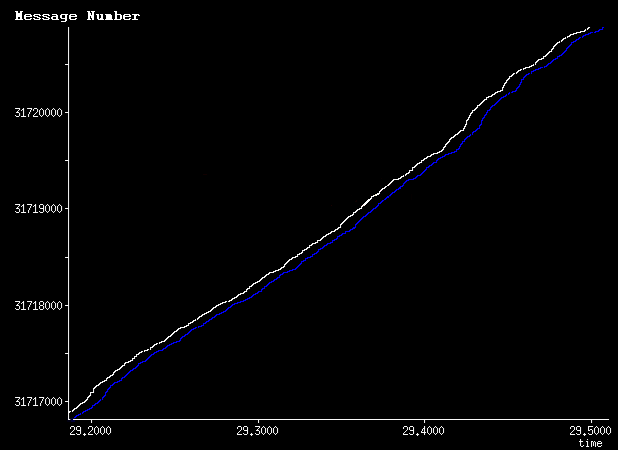
    For the following image, I've "zoomed in" on the same data. Now we can clearly see that there are actually two message streams: one plotted in white, and one plotted in blue:
    Redundant MoldUDP message streams
    It may look like the blue stream is "below" the white one, but it's not. The blue stream is "after" the white stream. Blue represents a redundant copy of the data that took a longer path from NASDAQ to the servers. Shift that blue stream to the left (earlier) by a few milliseconds, and the streams should overlap perfectly.

    Batching
    Taking an even closer look, we can see that each line is actually composed of discrete elements:
    Individual Packets
    Each white mark in that picture represents a single MoldUDP packet containing several messages. The length and positioning of the packet along the "message number" axis indicate exactly which messages are in the packet. Long marks indicate packets containing many messages. Short marks represent packets containing fewer messages.

    Handling Data Loss
    MoldUDP includes a retransmission capability so that receiving systems are allowed to request that lost data be resent. Rather than requesting the data from the source server, the receivers are configured to use a set of dedicated retransmission servers. It's not generally expected that the retransmission capability should be used because:
    • The latency might be unacceptable.
    • Retransmissions are unicast - sending retransmissions for dozens of unhappy receivers puts WAN links at risk.
    • Everything is redundant and diverse anyway -- we shouldn't have this problem.


    Stream Arbitration
    The receiving systems know the highest sequence number they've seen, and they're always looking for the next number in the sequence (highest + 1).

    Realities of geography mean that the data stream from NASDAQ's "A" site should always arrive at the feed handler NIC before the copy of the same data comes from NASDAQ's "B" site. The receivers don't know about the geography, have no expectation about which stream should deliver the next interesting packet. They just inhale the multicast stream arriving at each NIC (diversity!) and with each packet's arrival the messages either get processed because they're new, or trashed because the messages have been seen already.

    The receivers trash a lot of data, half of it, in fact. Every message delivered in blue packets that we've seen so far in these diagrams would be trashed because it is a duplicate of a previously-seen-and-processed message which arrived in a white packet.

    The Symptom
    The feed handler error logs indicated that the whole population of servers in one data center didn't receive three specific consecutive MoldUDP messages. Both streams were functional, and the many (many!) drop counters in the path did not indicate that there'd been any loss.

    Servers in the other data center had no problems. Servers in the test environment also had no problems.

    Analysis
    I pulled a couple of minutes of data from each of four sniffer points
    • The problem site's "A" feed handoff
    • The problem site's "B" feed handoff
    • The good site's "A" feed handoff (the "B" feed here was down because of a circuit failure)
    • The test site's "B" feed (no "A" feed in test because of budget constraints)
    Picking through the captures I was able to identify the "missing" data at each of the four sniffer points. Not only had the data been delivered to the site which logged the errors, it was delivered to that site twice. Both feeds had delivered the data intact.

    Interestingly, the missing data had been batched differently (this is not uncommon) by the two head-end servers:
    • The "A" server put these 3 messages into the end of a large MoldUDP packet, along with earlier messages that had been received correctly.
    • The "B" server batched these 3 messages into two different packets: one contained only the first missing message, the other contained the remaining two messages, plus a third message that had not been a problem.

    Bad NASDAQ Server
    The head-end servers responsible for this data feed had a nasty habit. Every now and then, one of them would just stop transmitting data. After 100 or 200ms or so the server would start back up.

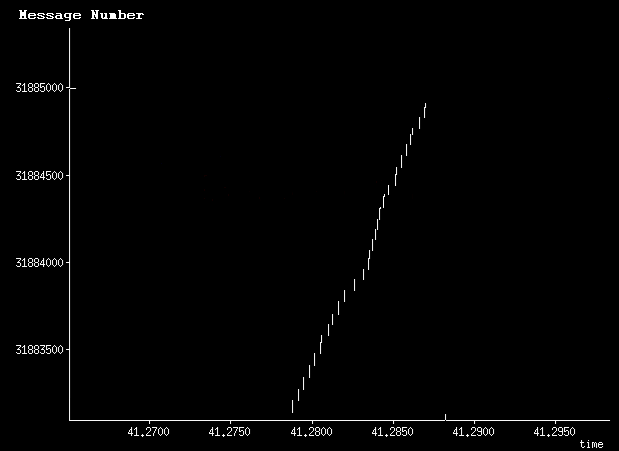
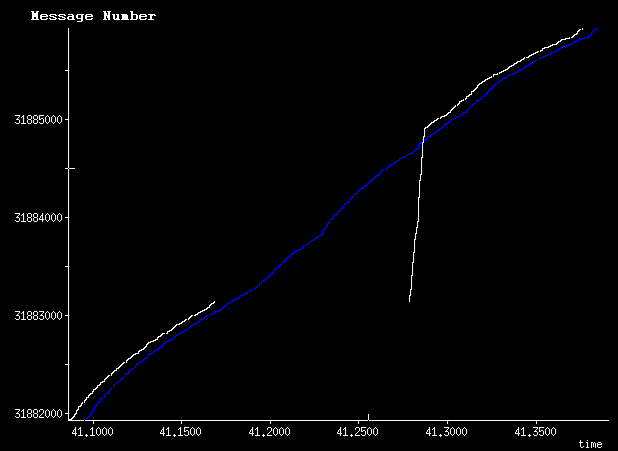
    When this freezing happens, no data gets lost. All the data gets delivered, but it gets delivered fast as the service "catches up" with real time. In 100ms we'd usually get hundreds of packets containing thousands of messages. When the blue server locks up there is no problem. His data was going to be trashed anyway. When the white server locks up, funny things happen. Here's what that looks like:
    100ms of silence from the primary site
    Remember that slope represents message rate. The slope of the white line hits around 200,000 messages per second (up from 6800) during the catch-up phase. Yikes.

    I know that the problem here is on the NASDAQ end, and not in the transit path because of the message batching. Usually we get between 1 and 5 messages per packet. Message batching during the catch-up interval was closer to 70 messages/packet. Only the source server (NASDAQ) could have done this. Network equipment in the transit path can't re-pack messages into fewer packets.

    Closer view of the problem
    When the primary NASDAQ server stopped talking around the 41.17 time mark, receivers were expecting message number ~31883100. It didn't arrive until the blue stream sent a packet containing that message around 20ms later. At this point, receivers stopped trashing blue data, and started processing messages from the blue stream.

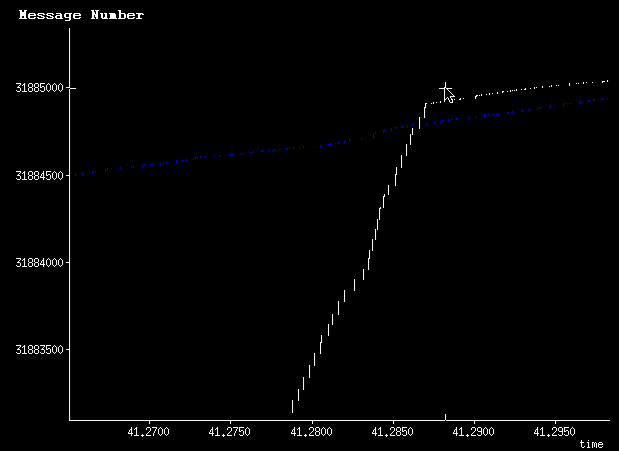
    Then, for about 100ms, servers received only "blue" data. Next, at 41.27, the backlog of "white" data started screaming in. Most of it was garbage (having already been delivered by the "blue" source) until we get to sequence ~31884700. At this point, the stream arbitration mechanism should switch back from "blue" data to "white" data. Here's a closeup of that moment:
    Takeover of primary data stream
    This is where things come off the rails. Note how large the white packets (~70 messages each) are when compared with the blue packets (~5 messages each). After the white stream is "caught up" to real time, the batching rate drops down to the usual ~5 messages/packet.

    What Went Wrong?
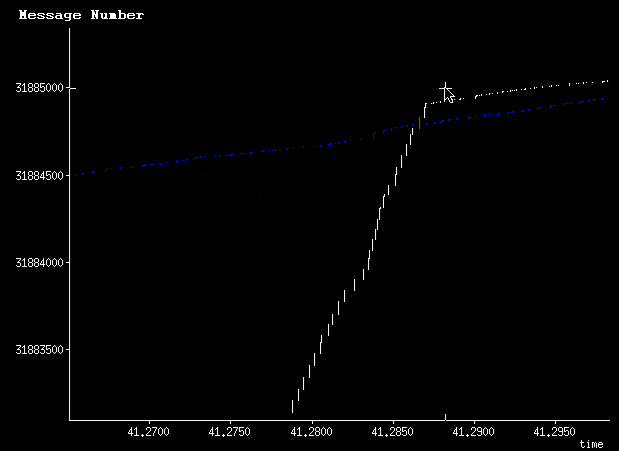
    Same picture as above, with extra color

    The stream arbitration mechanism should have dropped the blue stream, and picked up the white stream beginning with the packet that I've painted red. It didn't. Instead, the feed handler (a commercial product) was making the process-or-trash decision for each packet based solely on the first message sequence number from the MoldUDP header. The possibility that a packet might begin with old data but also contain some fresh data hadn't been considered, but that's what happened here.

    The red packet began with a sequence that had already been processed on the blue stream, so the feed handler trashed it. Next, another "white" packet arrived. This packet began with a sequence much higher than expected. Clank! Sproing! Gap detected, alarm bells rang, log files were written, etc...

    The "missing" data was actually present in the top half of that red packet, and then was delivered again a short time later in a series of "blue" packets. Rotten stream arbitration code in the feed handler was the whole problem here.

    No matter. The application said "network packet loss" so the problem landed in my lap :)

    I worked with the software vendor to get an enhancement -- now they check the sequence number and the message counter in each packet before trashing it. I'm guessing that things were implemented this way because an earlier version of MoldUDP didn't contain a message counter. With this previous version, the only way to determine exactly which messages appeared in a given packet was to walk through the packet from beginning to end. Yuck.

    No Problem in the Other Sites
    I'd previously said that only one of three environments had a problem. This was because the other environments weren't doing stream arbitration: The test environment only had one data stream because of cost concerns. The alternate production environment was running with only the one stream because of a circuit problem. These other sites didn't notice any problem because they never switched from one feed to the other.